News & Article

From the most remote corners of the Earth comes the fuel that makes modern life possible.

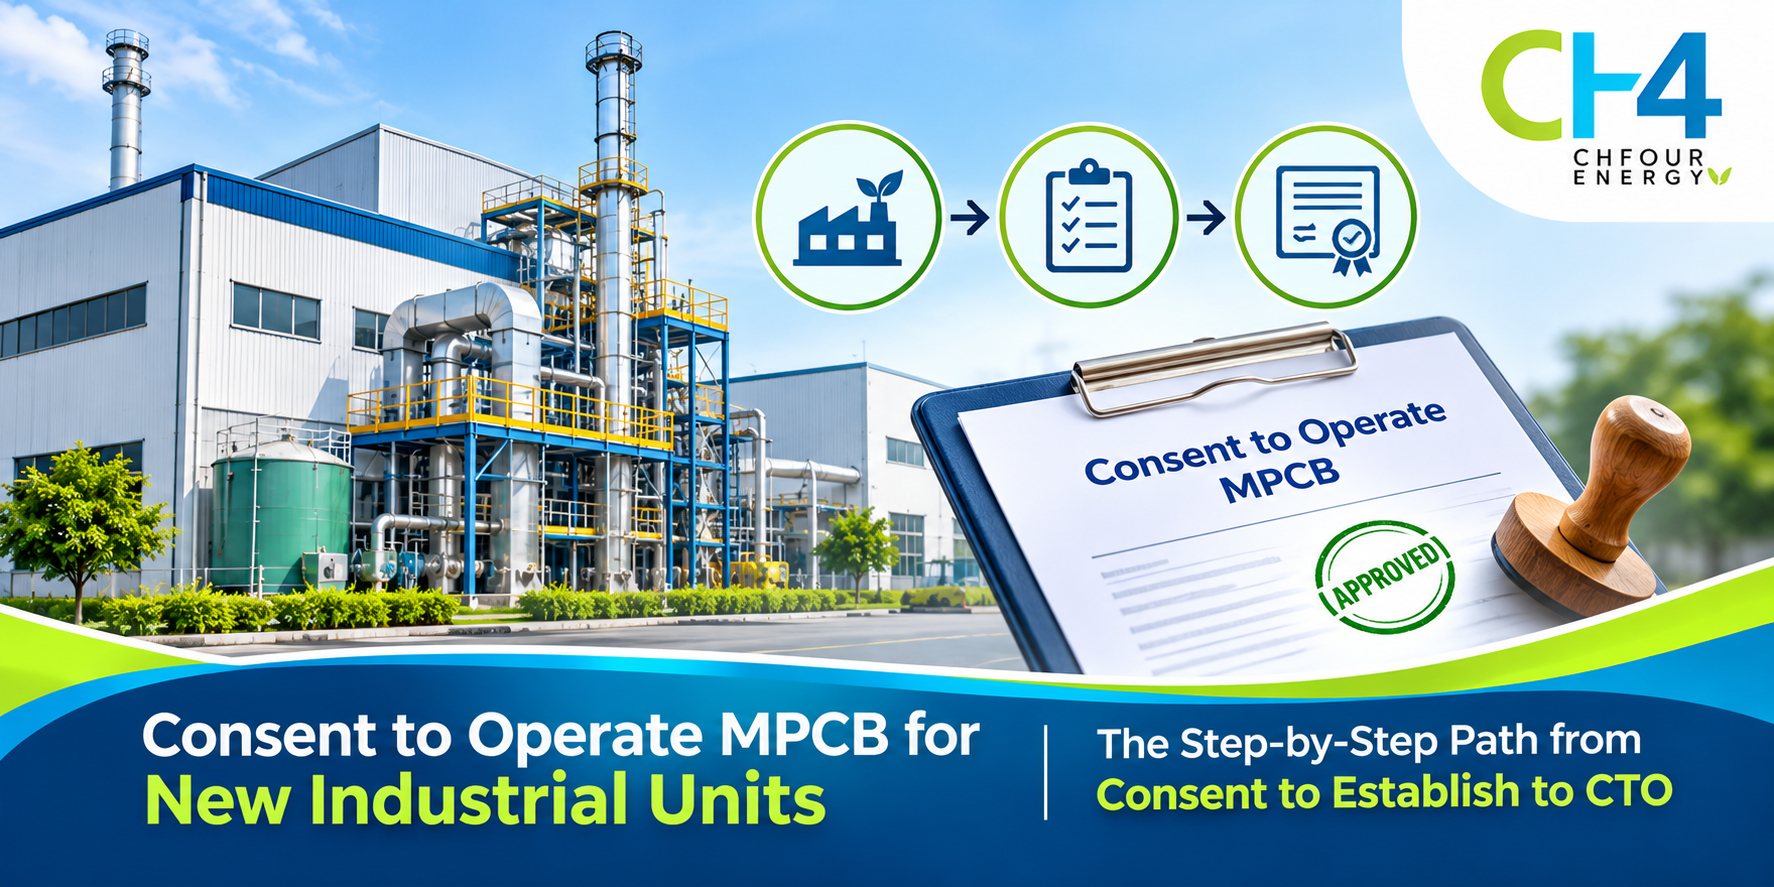
MPCB CTO Application Guide

Consent to Operate MPCB for New Industrial Units, Step by Step

Many new unit owners build first and think about consents later. That order causes delays, notices, and a late start to production. Getting Consent to Operate MPCB is a legal requirement before any industry begins running. It follows a Consent to Establish and depends on how well your site and pollution control systems are prepared. At CH Four Energy Solutions, we guide new units through every stage. This blog explains the full path in simple steps. Understanding MPCB Consents for a New Unit The Maharashtra Pollution Control Board issues two main consents to a new unit. Consent to Establish Consent to Establish, or CTE, is the first approval. You need it before you start construction or install machinery. The Board reviews your site, your process, and your plan for pollution control. Consent to Operate Consent to Operate, or CTO, comes after the unit is built. The Board checks that your installed systems match the approved plan. Consent to Operate MPCB permits you to start production. It is valid for a fixed period and must be renewed. Does Your Unit Need Consent The Board sorts industries by their pollution potential. Red, Orange, Green, and White Categories Red category units carry the highest pollution load and face the closest review. Orange and green units follow in that order. White category activities are largely exempt from consent. Your category decides the timeline and the depth of scrutiny. How to Check Your Category The Board publishes category lists based on activity and product. Check your exact process against the list. If you are unsure, an experienced MPCB Consultant can confirm the category before you apply. Before You Apply, Check Site and Zoning Some checks must be settled before any application is filed. Land Use and Industrial Zone Confirm that the land is approved for industrial use. Plots in a recognised industrial area are easier to clear. Other plots may need extra permissions. Siting Conditions and Other Approvals Certain industries must keep a set distance from homes, water bodies, or protected areas. Some projects also need environmental clearance first. Settle these points early to avoid rejection later. Applying for Consent to Establish The first application sets the base for everything that follows. Documents Required Prepare land documents, a site plan, and proof of incorporation. Add a detailed process description with raw materials and products. Include a water balance and the quantity of waste generated. Submit everything through the Board portal and pay the prescribed fee. Pollution Control System Details Show how you will treat effluent, sewage, air emissions, and hazardous waste. Include the design of your effluent treatment plant. A clear design reduces the number of queries from the Board. Scrutiny and Grant of Consent to Establish After submission, the Board studies your file and may visit the site. What the Board Reviews Officers check the site, the process, and the capacity of your control systems. They compare figures across documents. Any mismatch leads to a query. Replying to Queries Reply to every query on time and with complete data. Late or partial replies are a common reason for delay. Once satisfied, the Board grants the CTE with conditions. Building the Unit and Pollution Control Systems Construction must follow the plan that the Board approved. Building to the Approved Plan Do not change capacity, process, or layout without informing the Board. Changes can invalidate your consent. Trial Runs and Testing Install your treatment systems and run trials before you apply for the next stage. Collect test reports from an approved laboratory. These reports prove that your plant meets the limits. A reliable MPCB Consultant helps you organise this evidence in the format the Board expects. Applying for and Receiving Consent to Operate This is the final approval that lets production begin. Documents and Test Reports Submit the CTE copy, proof of installation, and treatment plant test results. Add authorisations for hazardous waste or other waste streams where they apply. Inspection and Grant Officers inspect the plant and check that the systems are running. They look at records, sample points, and housekeeping. After approval, the Consent to Operate MPCB carries conditions on discharge limits, monitoring, and returns. Common Reasons for Delay or Rejection Most delays come from avoidable mistakes. Document and Design Gaps Incomplete files and inconsistent figures slow the process. Pollution control systems that differ from the approved design also cause rejection. Starting Production Early Running the unit before the CTO is a violation. It can lead to notices, penalties, and closure directions. Wait for the consent in hand. Compliance After You Get the CTO Approval is only the beginning of your obligations. Records and Returns Maintain registers for operation, chemical use, and waste disposal. File the environmental statement and other returns on time. Plan Renewal Early Track the validity date and begin renewal well before expiry. A lapsed consent puts your production at risk. Handling It Yourself or Hiring a Consultant The right choice depends on your team and your timeline. Where Expert Help Saves Time A good MPCB Consultant knows the portal, the document formats, and the common queries. At CH Four Energy Solutions, we prepare applications, design the effluent treatment plant, and support you through inspection. Conclusion The path to Consent to Operate MPCB runs from site checks to CTE, installation, testing, and then CTO. Plan your pollution control systems early and keep your documents consistent. Follow the right order and your unit starts production without avoidable delay. Talk to CH Four Energy Solutions Get expert support for CTE, CTO, and effluent treatment plant setup. Visit chfour.net or contact CH Four Energy Solutions today and speak with an experienced MPCB Consultant about your project. Or contact our team at +91 8055573883 today.
Read More »
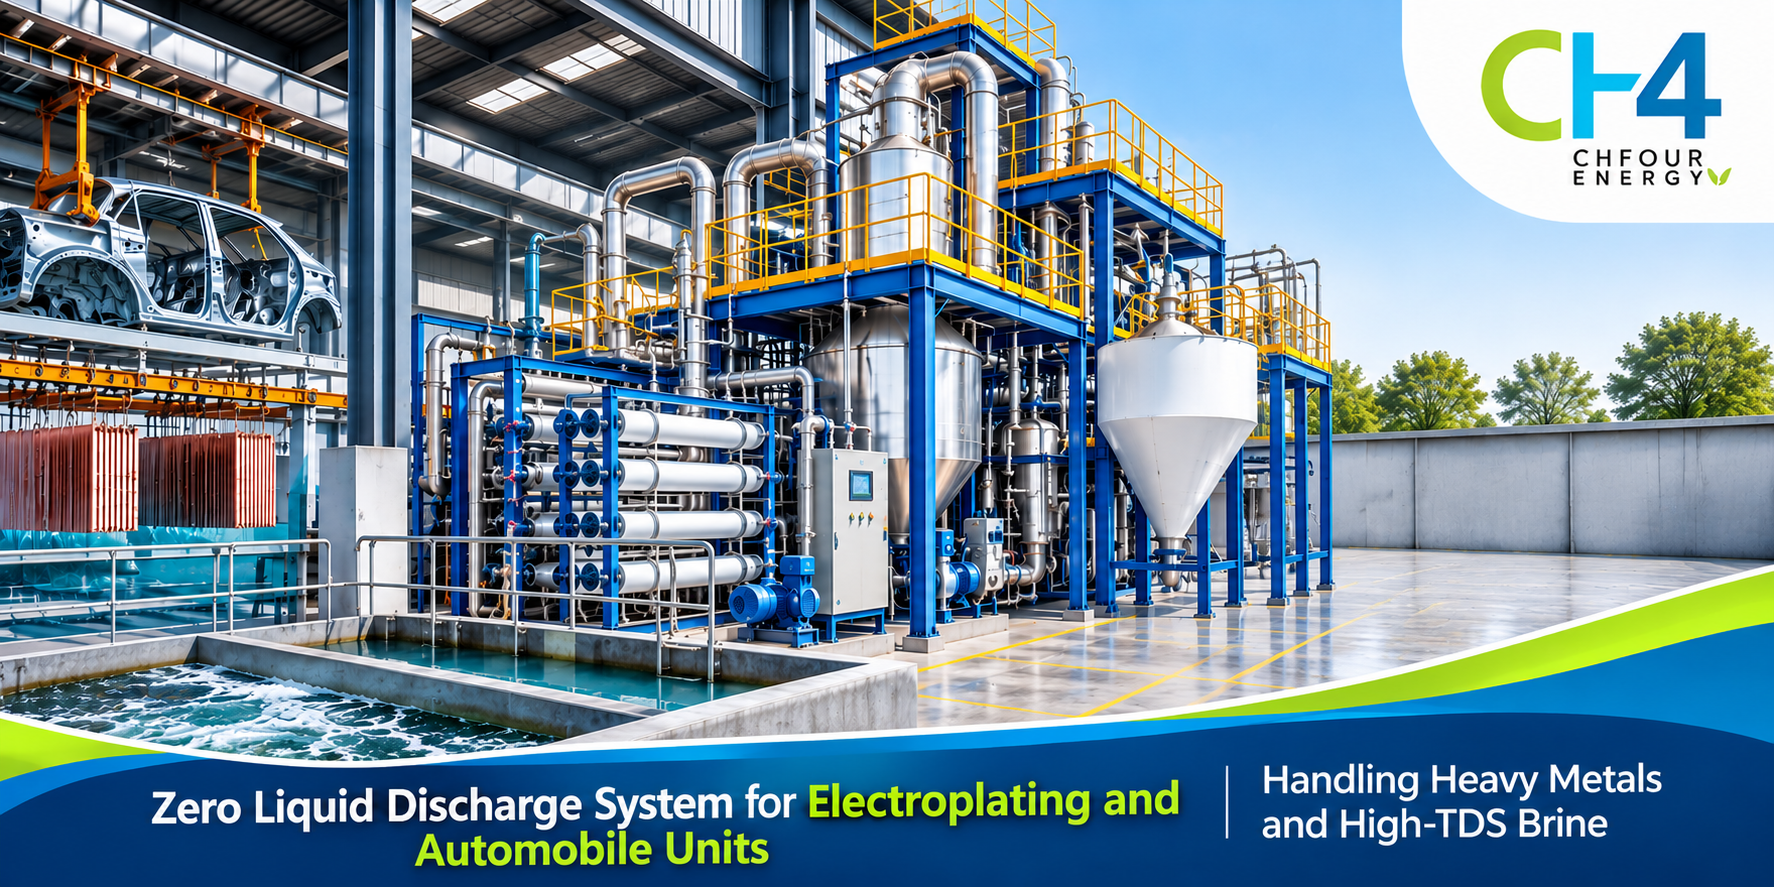
Zero Liquid Discharge System

Zero Liquid Discharge System for Electroplating and Automobile Units

Electroplating and automobile units produce wastewater that is hard to treat. It carries heavy metals and a high salt load together. A standard treatment plant cannot manage both for long. A Zero Liquid Discharge System solves this by recovering water and turning the rest into solids. At CH Four Energy Solutions, we plan and build these systems for metal finishing and auto component plants. This blog explains how a ZLD Plant works for these units and what to check before you invest. Why Electroplating and Automobile Wastewater Is Hard to Treat The difficulty starts with what these plants discharge. Sources in Plating and Auto Component Lines Plating lines release rinse water from chromium, nickel, zinc, and copper baths. Automobile units add wastewater from pretreatment, phosphating, painting, and machining coolants. Each stream has a different chemistry. Mixing them makes treatment harder. Knowing each stream is the first step toward a workable design. Knowing each stream is the first step toward a workable design. Why Heavy Metals and High TDS Together Cause Trouble Heavy metals must be removed before water can be reused. Dissolved salts stay behind after that. They damage membranes and push the TDS beyond discharge limits. Hexavalent chromium and cyanide streams need separate handling from the start. How a Zero Liquid Discharge System Differs From a Conventional ETP Many units run an ETP and wonder why it falls short. The Basic Principle A conventional ETP treats wastewater and discharges it. A Zero Liquid Discharge System sends no liquid out of the site. Water is recovered and reused. Salts and metals leave only as solids. Why Metal Finishing Units Face ZLD Directions Pollution control boards often direct metal finishing units toward ZLD. Heavy metals pose a risk to soil and groundwater. High TDS adds to that load. Consent conditions can also push a plant to adopt ZLD. Auto suppliers may also hear this request from their buyers. Auto suppliers may also hear this request from their buyers. Treatment Stages in a ZLD Plant for Electroplating Units A well planned ZLD Plant treats each stream in a set order. Segregation and Pretreatment Keep chromium, cyanide, and acid alkali streams apart at source. Reduce chromium to its safer form. Destroy cyanide through oxidation. Then send the streams to the main treatment line. Precipitation and Filtration Chemical precipitation turns dissolved metals into solid sludge. Clarifiers and filters separate this sludge from the water. Ion exchange or polishing filters then remove traces of metals. This step protects the membranes ahead. Skipping it shortens membrane life and raises running cost. Skipping it shortens membrane life and raises running cost. Reverse Osmosis and Evaporation Reverse osmosis recovers most of the water for reuse. The reject carries the salts. An evaporator and crystallizer concentrate it further. The water that comes out returns to the process. Managing High TDS Brine and Metal Sludge Brine and sludge decide the success of the whole system. Brine Handling and Evaporation Options High TDS brine comes from the RO reject. Multiple effect evaporators, mechanical vapour recompression, and agitated thin film dryers are common choices. The right pick depends on flow, TDS, and available energy. Effluent testing should come before any choice. Sample results show salt load and scaling risk. Sample results show salt load and scaling risk. Sludge and Salt Disposal Metal bearing sludge is hazardous waste. Dewater it and store it safely. Send it only to authorised treatment storage and disposal facilities. Keep manifests and records ready for inspection. Salt residue needs the same careful handling. ZLD for Automobile and Auto Component Units Automobile units have a different mix of streams from plating shops. Phosphating, Paint Shop, and Coolant Effluent Phosphating lines carry phosphate and metals. Paint shops add organics and solvents. Coolants add oil and grease. Each needs its own pretreatment before the common ZLD line. Combining Streams in One Scheme A single ZLD Plant can serve plating and non plating lines when streams are treated separately first. This saves space and cost. It also keeps operation simple. One control room can then run the whole plant. One control room can then run the whole plant. Cost and Operating Considerations The budget depends on a few clear factors. What Drives Capital Cost Wastewater flow, TDS, metal load, and evaporation technology drive the cost. Energy supply also matters. A detailed effluent study gives a reliable estimate. Fixed quotes without testing often change later. Fixed quotes without testing often change later. Water Recovery and Payback Recovered water cuts fresh water purchase. Plants that buy tankers or pay high water rates see this benefit sooner. Chemical and power costs must be counted as well. Mistakes to Avoid Most ZLD problems trace back to planning errors. Mixing Streams and Skipping Characterisation Mixing streams raises chemical use and sludge. Choosing technology before testing the effluent leads to redesign. Always characterise the effluent first. Underestimating Brine and Operator Training Brine volume is often underestimated. Untrained operators also cause membrane and evaporator problems. Plan training from day one. Choosing the Right ZLD Partner The right partner reduces risk at every stage. What to Look For Look for experience with metal bearing effluent. Ask for effluent testing and pilot trials. Check the support offered after commissioning. At CH Four Energy Solutions, we study your wastewater first, design stream by stream, and support operation after handover. Conclusion Electroplating and automobile wastewater needs a planned approach. Segregate streams, remove metals first, recover water, and manage brine carefully. A Zero Liquid Discharge System does this in a controlled way and keeps your plant compliant. A properly designed ZLD Plant also lowers your dependence on fresh water. Talk to CH Four Energy Solutions Request an effluent audit or ZLD feasibility study for your plant. Visit chfour.net or contact our team at +91 8055573883 today.
Read More »
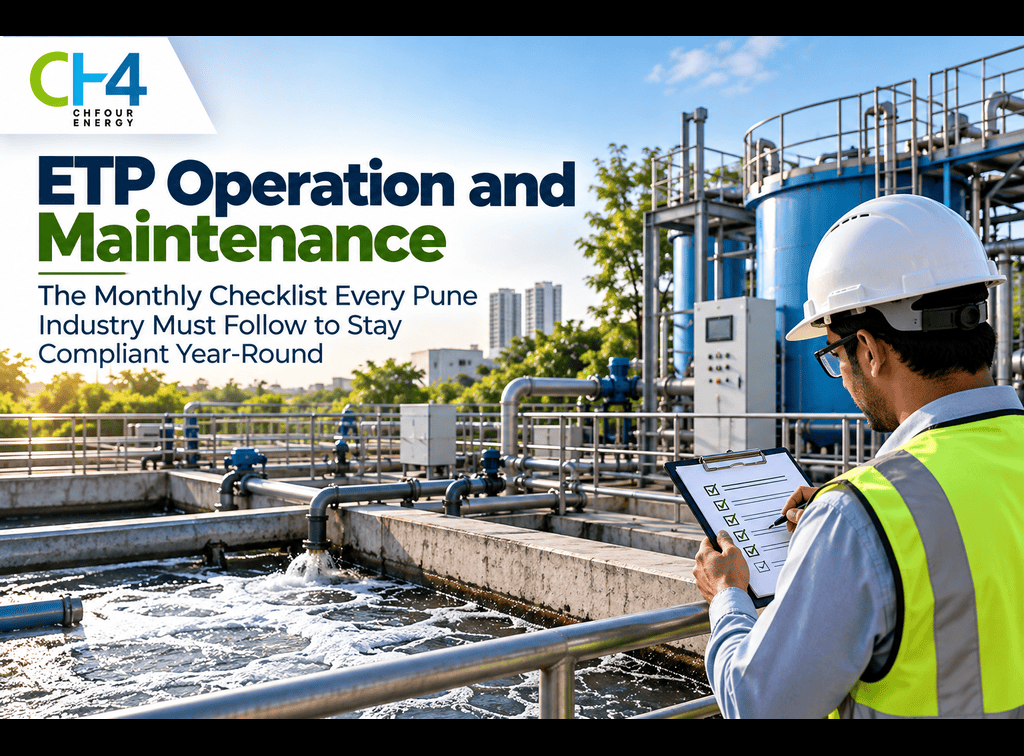
ETP Maintenance Checklist

ETP Operation and Maintenance: The Monthly Checklist Every Pune Industry Must Follow to Stay Compliant Year-Round

Installing an Effluent Treatment Plant is only the first step. Staying compliant depends on how well it is run every single day. Most failures we see come from missed checks and poor records, not from poor design. A good Effluent Treatment Plant in Pune has to meet MPCB norms in every inspection. This blog gives you a clear monthly routine to follow. CH Four Energy Solutions built it from our work on industrial plants. Use it as a working document for your operator and your compliance team. Why ETP Operation and Maintenance Decides Your Compliance Compliance is built through routine, so it helps to see where problems begin. Where Compliance Failures Start Failures rarely happen overnight. A blower runs low for weeks. Dosing pumps drift off setting. Sludge builds up in the clarifier. Each small gap lowers treatment quality. By the time outlet samples fail, the cause is already old. What MPCB Inspections Look At Officers check outlet quality, running condition, and records. They compare your logs with sample results. They also check that the plant runs as stated in your consent to operate. Missing registers can count against you even when the water is clean. Daily and Weekly Checks Small habits keep the plant stable between monthly reviews. Daily Readings to Log Record flow, pH, dissolved oxygen, and sludge level every day. Note any odour, foam, or colour change. These readings show a problem early. They also give you proof of control during audits. Keep the log sheet at the plant so entries are made on the spot. Weekly Equipment Walk-Round Walk the plant once a week. Check pumps, blowers, and dosing units for noise, heat, and leaks. Test the sample points and clean the screens. Fix small faults before they stop the plant. The Monthly ETP Maintenance Checklist Split the monthly work into four weeks so nothing gets skipped. Week One Mechanical Inspection Inspect motors, bearings, belts, and gearboxes. Grease moving parts as per the maker schedule. Check valves and pipe supports. Replace worn parts now, not after a breakdown. Week Two Biological Review Review MLSS, sludge age, and the food to microorganism ratio. Look at the colour and smell of the aeration tank. Check for foaming and poor settling. Adjust sludge wasting and nutrient dosing where needed. Small changes made early prevent large upsets later. Week Three Chemical Dosing and Lab Checks Confirm dosing rates for coagulants, polymers, and pH correction chemicals. Calibrate dosing pumps. Test inlet and outlet samples for BOD, COD, TSS, and pH. Compare results with your consent limits. Week Four Sludge and Records Check the filter press and sludge drying area. Record the quantity of sludge generated and sent out. Keep disposal receipts from authorised handlers. Close the month by reviewing every log for gaps. Quarterly and Annual Tasks Some jobs only come around a few times a year, and they matter just as much. Tank Cleaning and Diffuser Checks Clean tanks on a fixed schedule. Inspect diffusers for clogging and membrane damage. Poor aeration is a common reason for odour and high COD. Write down the date and findings after each cleaning. Calibration and Third Party Testing Calibrate pH meters, flow meters, and online monitors. Send samples to an approved laboratory for independent results. Keep every report in the audit file. Staying Compliant With MPCB in Pune Pune industries must match their daily practice with their consent conditions. Records You Must Maintain Keep registers for operating hours, chemical use, power use, sludge disposal, and test results. Make sure entries are dated and signed. An inspector should find any record within minutes. A well kept Effluent Treatment Plant in Pune shows its history clearly. Store scanned copies as a backup. Returns and Statements File the required returns and the annual environmental statement on time. Track consent renewal dates. Keep copies of every submission. Late filing creates avoidable problems. Common Problems and Quick Fixes Most ETP faults give a warning sign before they turn serious. Odour, Foam, and Poor Settling Odour usually points to low oxygen. Foam points to loading or sludge age. Poor settling points to bulking sludge. Check aeration and MLSS first. Sudden Rise in COD or Colour A sudden rise often follows a change in the process stream. Check the equalisation tank and recent production changes. Review the biological stage before changing chemicals. In-House Team or O&M Partner Your plant needs trained people, and not every unit can keep them. What a Good Operator Must Know An operator should read lab results, understand biology, and handle equipment safely. Training takes time. Staff turnover can undo that effort quickly. When Outsourcing Makes Sense Outsourcing helps when you lack skilled staff or face repeated notices. A specialist team brings a fixed routine, records, and quick response. Many plants find a monthly review by outside engineers a useful second pair of eyes. At CH Four Energy Solutions, we run operation and maintenance for industrial plants with trained engineers and clear reporting. Our team keeps your Effluent Treatment Plant inside its limits through the year. Conclusion A steady routine keeps an Effluent Treatment Plant compliant. Daily logs, monthly checks, and timely records protect your consent and your production. Industries that follow a fixed schedule face fewer shutdowns and lower repair costs. Working with an experienced partner for your Effluent Treatment Plant in Pune makes this easier. Talk to CH Four Energy Solutions Book an ETP health check with CH Four Energy Solutions. We will review your plant, your records, and your consent conditions. Contact our team today at 8055573883 and get your queries answered.

Read More »
ZLD System vs Conventional ETP

ZLD System vs Conventional ETP: What’s the Actual Difference and When Does Your Industry Need to Make the Switch?

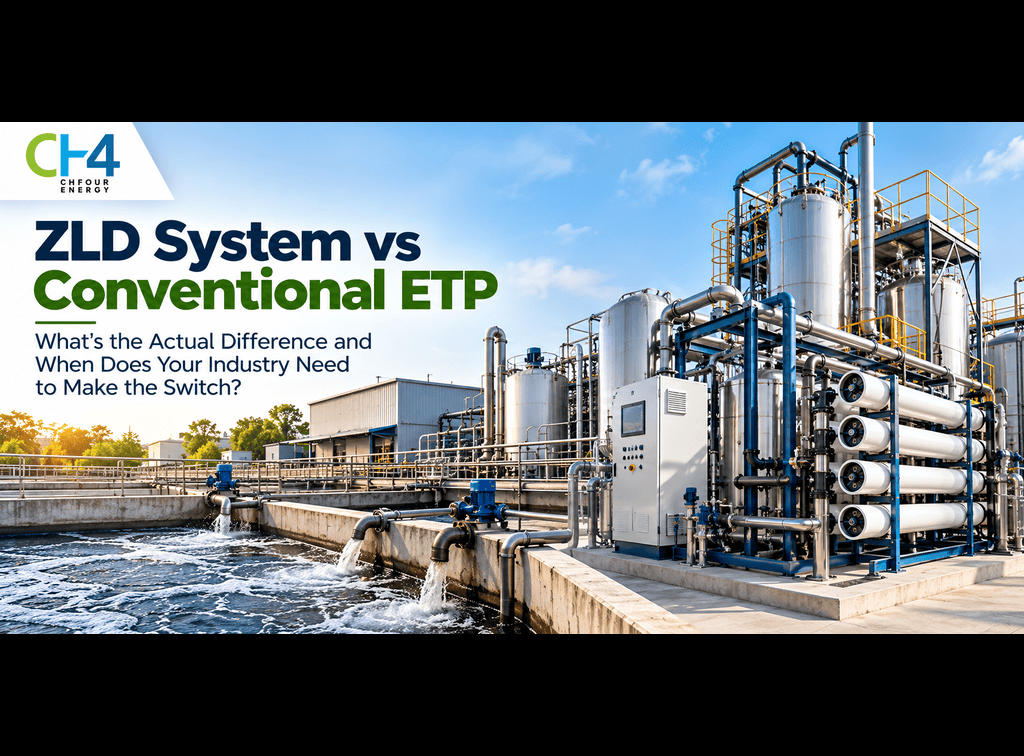
Most industries already run an Effluent Treatment Plant. It treats wastewater and brings it within the discharge limits set by the pollution control board. Today, water costs are rising and regulators are asking for more. A Zero Liquid Discharge System is now part of that conversation. At CH Four Energy Solutions, we design and support both options. This blog explains how they differ and when a switch makes sense. What Is a Conventional ETP and What Does It Do? Let us start with the system most plants already have. How an Effluent Treatment Plant Works An Effluent Treatment Plant cleans industrial wastewater in stages. Primary treatment removes solids, oil, and grease through screening and settling. Secondary treatment uses bacteria to break down organic matter. Tertiary treatment polishes the water using filters or disinfection. The treated water is then discharged or reused for gardening and cooling. Most ETPs are built to meet standard norms for pH, BOD, COD, and suspended solids. Where a Conventional ETP Falls Short An ETP does not remove dissolved salts well. Total dissolved solids, or TDS, stay in the water after treatment. Colour and hard COD can also pass through. When norms get tighter, these gaps lead to consent issues, notices, and penalties. This is the gap a ZLD Plant is built to close. What Is a ZLD System and How Is It Different? A ZLD system goes much further than an ETP. The Idea Behind Zero Liquid Discharge As the name says, a Zero Liquid Discharge System sends no liquid waste out of the site. Every drop of wastewater is treated and recovered. The water goes back into the process. The dissolved salts are separated as solids and disposed of safely. Main Stages of a ZLD Plant A ZLD Plant usually begins with an ETP as its front end. The treated water then passes through reverse osmosis, which recovers most of the water. The reject stream, which carries the salts, goes to an evaporator. A crystallizer or agitated thin film dryer turns the final concentrate into solid residue. This is why ZLD is a larger and costlier setup than a standalone ETP. ZLD vs ETP Key Differences The two systems solve different problems, and the gap shows up in a few clear areas. Water Recovery and Reuse A conventional ETP allows limited reuse and discharges the rest. A ZLD system recovers nearly all the water for reuse. This cuts fresh water intake in a big way. Cost, Energy, and Space An ETP costs less to build and run. ZLD needs more capital, more energy, and more land because of the evaporation stage. Water savings offset part of these costs over time. Waste Handling An ETP produces sludge. A ZLD system produces sludge and salt residue. Salt disposal needs planning and authorised handling. Plants must account for this before choosing ZLD. When Should Your Industry Switch to ZLD? The decision depends on rules, water supply, and the quality of your treated effluent. Regulatory Triggers Some pollution control boards direct certain industries to adopt ZLD. This often applies to textile, dyeing, distillery, and chemical units. A direction in your consent order is the clearest sign. Water and Operational Triggers Frequent tanker purchases show a water supply problem. Rising water bills point the same way. When borewell levels fall, reuse becomes more valuable. In these cases, a ZLD Plant can pay back through water recovery. Technical and Business Triggers High TDS in treated water is a technical warning. Repeated failures in discharge tests are another. On the business side, export buyers and ESG reports now ask about water practices. Which Industries Usually Need ZLD? Needs vary by sector, so it helps to look at where ZLD is most common. Sectors Where ZLD Is Common Textile processing, pharmaceuticals, bulk drugs, specialty chemicals, distilleries, and some power and steel units commonly require it. Their wastewater carries high salts and hard to treat organics. Sectors Where an ETP Is Often Enough Engineering units, auto component makers, and many food units often manage with a well run Effluent Treatment Plant. For them, the better step is to upgrade and maintain the existing plant before thinking about ZLD. Mistakes to Avoid When Moving From ETP to ZLD Many plants hurry this decision, and that is where the trouble starts. Skipping the Fix on the Existing ETP A ZLD system depends on the ETP ahead of it. A weak ETP sends poor quality water to the RO and fouls the membranes. Stabilise the ETP first. Ignoring Segregation and Salt Disposal Mixing high TDS streams with low TDS streams raises the load on evaporators. Segregating at source lowers cost. Salt disposal also needs a clear plan from day one. How CH Four Energy Solutions Can Help We look closely at your plant before we recommend anything. Our Approach to ETP and ZLD At CH Four Energy Solutions, we start with a study of your effluent, flow, and consent conditions. Some plants need an upgrade to their Effluent Treatment Plant. Others need a full ZLD Plant. We tell you which one fits, and we do not push a bigger system than you need. Conclusion An ETP treats wastewater to meet discharge norms. A Zero Liquid Discharge System removes discharge altogether and recovers the water. The right choice depends on your regulations, water situation, and effluent quality. Deciding early saves cost and avoids compliance trouble later. Talk to CH Four Energy Solutions Request a plant assessment and get clear advice on your Effluent Treatment Plant or ZLD Plant needs. Contact our team at 8055573883 to get started.

Read More »
MPCB Consent to Operate Renewal

MPCB Consent to Operate Renewal What Gets Rejected What Has Changed and How to Get It Right the First Time

Many industries treat Consent to Operate renewal as routine paperwork. This assumption often backfires. The Maharashtra Pollution Control Board reviews compliance history closely before approving any renewal. A missed detail can delay or reject an application. Industries that prepare only when the deadline is near tend to face avoidable rejections. This blog explains what commonly leads to rejection, what has changed in the renewal process and how to prepare a clean application. CH Four Energy Solutions supports industries through this process from start to finish. Why Renewal Is Not Just a Formality Consent renewal reflects ongoing compliance, not a one time approval. What the Consent Actually Authorizes A valid consent allows a unit to operate legally within set environmental limits. Once it lapses, continued operation becomes a compliance violation. Many industries only realize this once production is already affected. Renewal is not a separate approval but a continuation of the same legal standing the unit already holds. Why the Risk Is Often Underestimated Renewal timelines are frequently underestimated by plant teams. Applications submitted close to the expiry date leave little room for corrections. A rejected application at this stage can pause operations completely. Teams that start early have time to fix small issues before they turn into rejections. Common Reasons Renewal Applications Get Rejected Most rejections follow a small set of recurring issues. Incomplete or Outdated Documentation Missing compliance reports or expired certificates are flagged early in the review. The Maharashtra Pollution Board expects documentation that matches current operations exactly. Even small mismatches can trigger a query or rejection. Capacity and Parameter Mismatches Production capacity on record must match actual operations on the ground. Discharge or emission readings above sanctioned limits are treated seriously. Pending issues from earlier inspections often resurface during renewal review. Even a small expansion in output that was never formally updated can raise questions during the review stage. Portal and Filing Errors Errors in the online application form are another frequent cause of delay. Incorrect category selection or mismatched unit details can trigger avoidable queries. Reviewing the filled form carefully before submission catches most of these mistakes. What Has Changed in the Renewal Process The renewal process has shifted toward more data driven verification. Greater Reliance on Monitoring Data Online monitoring data now plays a larger role in renewal decisions. Systems that report inconsistent or delayed data face closer scrutiny. This shift rewards industries with consistent, real time compliance records. The Maharashtra Pollution Control Board treats continuous data gaps as a red flag during review, even when overall parameters remain within limits. Updated Portal and Documentation Requirements The application portal has introduced stricter validation checks in recent cycles. Self certification requirements have also expanded for several categories. Industries relying on older formats often face avoidable delays. Documents and Checks Required Before Applying Preparation before filing saves significant time during review. Core Document Checklist Keep the existing consent copy, compliance reports and monitoring records ready. Land and building approvals should also be verified as current. Missing even one document can stall the entire application. Verifying Compliance Status Check effluent treatment records, air pollution control data and waste handling logs. Every pending observation from past inspections should be closed beforehand. A clean compliance record speeds up the entire review process. Industries that keep these records updated year round rarely face surprises when the Maharashtra Pollution Board initiates its review. How to Avoid Rejection the First Time A short internal review before filing prevents most common issues. Run a Pre Renewal Compliance Check Review documentation, monitoring data and capacity records well before the deadline. Address any gaps immediately rather than during the review stage. This single step prevents most delays industries face today. Keep Records Inspection Ready Year Round Compliance should not be treated as a task reserved for renewal season. Keeping monitoring systems, test reports and logs updated continuously makes the actual filing straightforward. Industries that follow this habit rarely encounter last minute surprises. What Happens If Renewal Gets Rejected or Delayed A rejection at this stage carries real operational consequences. Immediate Impact on Operations A lapsed consent can force a unit to pause production until the issue is resolved. This affects supply commitments and adds unplanned costs. Reapplying after rejection also means starting the review timeline again. Why Early Preparation Avoids This Stage Most rejections trace back to gaps that existed well before the application was filed. Addressing those gaps early removes the need for an appeal or reapplication altogether. This is the outcome a proactive approach is built to achieve. How CH Four Energy Solutions Supports CTO Renewal CH Four Energy Solutions helps industries prepare complete and accurate renewal applications. Our team reviews documentation, monitoring records and compliance history together. We also assist with application filing and coordination with the Maharashtra Pollution Control Board. This structured approach reduces rejection risk and saves valuable time. Conclusion Consent to Operate renewal outcomes are decided long before the application is filed. Ongoing compliance with the Maharashtra Pollution Board matters far more than last minute paperwork. A proactive review today prevents delays and rejections later. CH Four Energy Solutions can help you prepare a renewal application that gets approved the first time. Reach out to CH Four Energy Solutions to review your renewal readiness today. Call us today at +91 80555 73883 and our team will guide you through every step so your approval process stays smooth and on schedule.

Read More »
MPCB ETP Compliance Guide

Your ETP Is Running — But Is It Actually Compliant? What Pune Industries Must Check Against the Latest MPCB Discharge Standard

Many Pune industries assume their Effluent Treatment Plant is compliant simply because it runs every day. This assumption can turn costly. The Maharashtra Pollution Board tracks specific discharge parameters, not plant activity alone. A functioning system does not always meet current norms. Inspectors look at test reports, monitoring data and documentation, not machine uptime. Industries that skip regular verification often discover gaps only after a notice arrives. This blog explains what Pune industries must check today, why standards keep evolving and how a proactive review protects daily operations. CH Four Energy Solutions helps companies close these gaps before they turn into penalties. Running and Compliant Are Not the Same Thing Plant operation and regulatory compliance are measured in very different ways. The Gap Most Industries Overlook A treatment system can run continuously and still fail an inspection. Compliance depends on discharge quality, not equipment activity. Many industries confuse maintenance schedules with regulatory readiness. These are two separate processes with separate requirements. Steady output on the floor and acceptable discharge quality on paper are two different measures of performance. What This Gap Actually Costs Non compliance can lead to fines, show cause notices or suspension of the consent to operate. Production often stops while corrective steps are completed. The cost of downtime usually exceeds the cost of a timely review. Repeated violations can also affect renewal timelines for future approvals, adding further delay to normal operations. Understanding Current Discharge Standards Discharge norms exist to protect water bodies and public health across the state. Parameters That Matter Most Authorities check BOD, COD, TSS, pH and oil content before approving discharge. Heavy metal limits apply to certain industry categories as well. Every parameter carries a defined threshold that changes with discharge type, whether it goes into a sewer, surface water or land for irrigation. Why Standards Keep Changing The Maharashtra Pollution Board revises limits based on environmental data and sector risk. Industries relying on older assumptions can fall behind without noticing. Reviewing current notifications regularly helps prevent this drift. Staying updated also makes future audits faster, since teams are not scrambling to catch up on new requirements at the last moment. A Practical Checklist for Pune Industries A short internal review can reveal issues long before an inspector does. Documentation and Monitoring Confirm the consent to operate is valid and current for the site. Check that online monitoring equipment is calibrated and reporting accurately. Missing documentation remains one of the most common inspection failures. Keep test reports, calibration certificates and renewal papers organised in one accessible file. Capacity and Performance Compare the Effluent Treatment Plant’s design capacity with the actual daily load. Overloaded systems rarely meet discharge parameters on a consistent basis. Sludge handling records should also be reviewed and kept updated. A capacity mismatch is often the root cause behind repeated parameter failures, even when the equipment itself is working fine. Seasonal production spikes can push load beyond design limits without anyone noticing until a test report comes back out of range. Common Gaps Found During Inspections Most compliance failures tend to follow a similar, avoidable pattern. Equipment and Reporting Issues Uncalibrated sensors and outdated monitoring systems appear often in inspection findings. Delayed data submission is treated as a violation in many cases. These issues are usually fixable within days, not weeks, once they are identified through a proper internal check. What Happens After an Inspection Flags a Gap A show cause notice usually gives industries a defined window to respond with corrective action. Ignoring this window can lead to stricter enforcement, including closure directions in serious cases. Acting quickly and documenting every fix keeps the process from escalating further. How Pune Industries Can Stay Ahead Staying compliant works best as an ongoing habit rather than a one time task. Build a Compliance Calendar Track renewal dates, testing schedules and reporting deadlines in a single place. A calendar approach prevents last minute scrambling before scheduled inspections. Many industries also benefit from a periodic third party review of their system, since an outside perspective often catches gaps that internal teams overlook. Assigning clear ownership for each task also helps, so compliance does not depend on one person remembering every deadline. How CH Four Energy Solutions Supports Compliance CH Four Energy Solutions works with Pune industries to review their treatment system performance against current norms. Our team checks documentation, testing records and system capacity together as one process. We also assist with regulatory liaison work and renewal support. Our engineers assess whether existing equipment needs recalibration, retrofitting or a full capacity upgrade, and guide the process from assessment to closure. This approach reduces the risk of last minute compliance issues considerably. Conclusion A running Effluent Treatment Plant is not proof of compliance on its own. Standards set by the Maharashtra Pollution Board change over time, and industries must review their systems regularly. A short internal check today can prevent a costly notice later. CH Four Energy Solutions can help you verify exactly where your plant stands right now. Get in touch with CH Four Energy Solutions for a compliance review of your treatment system today. Our team will walk you through exactly where you stand against current norms and what to fix first, so your operations continue without interruption. Contact Us today at +91 80555 73883 and our team will guide you through.

Read More »
Food Waste Biogas

Your Leftover Food Could Power a Kitchen: How Food Waste Biogas Actually Works

Every hotel kitchen in India pays two bills for the same food. First, an LPG bill to cook the meals. Then, a disposal bill to haul the leftovers away. Most properties accept this as normal. It is not. Hotels and restaurants across India are now installing Food Waste Biogas systems to break this cycle. The leftover food goes into a digester on the property. Biogas comes out. That gas is piped directly into the kitchen. The disposal cost drops. The LPG bill shrinks. And the property has a documented waste management process that satisfies Solid Waste Management Rules. At CH Four Energy Solutions, we design and install these systems for hotels, housing societies, hospitals, and campuses across Pune and Maharashtra. This guide explains how the process works and what it delivers. The Double Cost That Most Properties Are Still Paying Food waste is expensive twice over, and most facility managers have not calculated both costs together. Disposal Costs Add Up Every Single Day A hotel generating 100 kg of food waste daily pays for collection, transportation, and landfill disposal 365 days a year. These costs are rising. Under the Solid Waste Management Rules, bulk waste generators producing more than 100 kg per day must manage organic waste on-site. Properties that continue to send it to landfills are increasingly receiving compliance notices from municipal bodies and MPCB in Maharashtra. The LPG Bill That Does Not Need to Be That High At the same time, the kitchen is burning through LPG cylinders every week. India imported LPG worth over Rs 1.06 lakh crore in 2024-25. Supply disruptions, price hikes, and distribution delays hit commercial kitchens hardest. Hotels, hospital kitchens, and housing society canteens are the most exposed to these fluctuations. Converting food waste into cooking gas directly reduces that exposure. What Is Food Waste Biogas and How Does It Form The science behind biogas is straightforward, and it happens naturally when organic matter breaks down without oxygen. Bacteria Do the Work Inside the Digester When food scraps, vegetable peels, cooked leftovers, and kitchen waste enter a sealed digester tank, bacteria consume the organic material. No oxygen is present. The bacteria produce methane as a byproduct. That methane is biogas. It is the same combustible gas that makes up LPG and natural gas. One tonne of food waste produces approximately 150 to 200 cubic metres of biogas under standard digester conditions. What Goes In and What Comes Out The inputs are everyday kitchen waste items. Cooked leftovers, raw vegetable trimmings, fruit peels, stale food, and canteen discards all qualify. The waste is shredded to reduce particle size before entering the digester. This speeds up bacterial breakdown and increases gas yield. Two outputs come from the process. The first is biogas, which goes to the kitchen. The second is digestate, a nutrient-rich organic slurry that works as a natural fertilizer for gardens and landscaping. How a Biogas Plant Works Step by Step The process follows a fixed sequence regardless of whether the plant is at a hotel, a housing society, or a corporate campus. Waste Collection and Shredding Kitchen staff segregate wet organic waste into dedicated bins at the source. The collected waste enters a shredder that reduces particle size to under 12mm. Smaller particles mean more surface area for bacteria to work on. Gas production begins faster and yields more per kilogram of waste. The Digester Produces the Gas The shredded waste enters the main digester as a slurry. Bacteria in the digester work through the organic material over a retention period of 15 to 20 days. The digester operates between 33 and 38 degrees Celsius. This temperature range keeps the bacterial population active and productive. Gas collects at the top of the sealed digester as it is produced. Gas Purification and Kitchen Piping Raw biogas contains hydrogen sulphide, which is corrosive to pipes and appliances. A scrubber removes it before the gas moves to storage. Clean biogas is stored in a gas holder that maintains steady pressure. From there, it is piped directly into the kitchen gas manifold. Kitchen staff use it the same way they use LPG. The two fuel sources can run in parallel with a simple switching arrangement. How Much Gas Can Your Property Actually Produce Output depends on daily waste volume, the organic content of that waste, and digester operating conditions. Practical Output Numbers by Property Type A hotel producing 100 kg of food waste daily generates enough biogas to replace several LPG cylinders per month. A housing society canteen producing 30 to 50 kg daily can cover a meaningful portion of its daily cooking fuel needs. A hospital kitchen generating 60 to 80 kg per day can run a dedicated gas supply line for kitchen use. A well-managed Canteen Waste Based Biogas Plant at a corporate campus or institution operates at this scale reliably once the daily waste stream is consistent. What This Means for Your LPG Bill Commercial biogas plants for hotels and institutions typically deliver a return on investment within 3 to 5 years. Savings come from fuel replacement, reduced waste disposal costs, and in some configurations, electricity generation from excess gas. The larger and more consistent the daily waste stream, the faster the payback. Who Is Using Food Waste Biogas in India Right Now This technology is not experimental. It is operational across multiple property types in India today. Hotels and Restaurant Groups Hotels and restaurant groups in Bengaluru, Pune, and other Indian cities have installed biogas systems to offset rising LPG costs. The kitchen integration is direct and does not require changes to cooking equipment. Biogas runs through the existing manifold alongside LPG. During peak kitchen hours, the biogas covers a fixed portion of fuel demand. The LPG cylinders last longer. The disposal vendor comes less often. Housing Societies and Canteen-Heavy Campuses Residential townships and housing societies that run shared canteens are strong candidates for a Canteen Waste Based Biogas Plant. Daily canteen waste from resident kitchens and common dining areas provides

Read More »
Zero Liquid Discharge Systems

Where Does Factory Wastewater Actually Go? A Simple Guide to Zero Liquid Discharge Systems

Most factory managers can tell you how much wastewater their plant generates every day. But ask where that water actually goes after it leaves the production floor, and the answers get vague quickly. This is a problem. India generates approximately 6.2 billion litres of industrial effluent every day. A significant portion of that volume is discharged without proper treatment. CPCB enforcement is now active, inspections are unannounced, and water connections are being cut across non-compliant facilities. At CH Four Energy Solutions, we work with factories every day to understand, treat, and manage their wastewater. This guide explains the full journey, from the moment effluent leaves a machine to how a Zero Liquid Discharge System ensures none of it ever leaves the premises as liquid waste. What Industrial Wastewater Actually Contains Not all factory wastewater looks the same, and the difference matters enormously for treatment. The Composition Changes by Industry Textile dyeing units produce effluent loaded with dyes, sodium sulphate, and high dissolved solids. Pharmaceutical plants release API residues and solvents. Tanneries generate chromium-heavy, high-COD streams. Food processing units deal with fats, oils, and high biological oxygen demand from organic waste. Each of these streams behaves differently in treatment. A system designed for textile effluent will not perform the same way on pharmaceutical waste. This is why site-specific design is not optional. It is the foundation of a treatment plant that actually works and stays compliant. Stage One: The Effluent Treatment Plant Before advanced treatment begins, every factory runs wastewater through a primary treatment sequence. Primary Treatment Removes Physical Contaminants Screens and settling tanks remove large suspended solids first. Dissolved air flotation units bring fats and fine particles to the surface for removal. pH correction brings the effluent to a range where biological treatment can function. Secondary Treatment Handles the Biological Load Aeration tanks introduce microorganisms that break down dissolved organic matter. Technologies like MBBR and SBR are widely used across Indian industries for this stage. The output is cleaner than what entered, but not yet clean enough for reuse or zero discharge. Sludge Is a Compliance Obligation Too Every treatment stage generates sludge. Under the Hazardous Waste Management Rules, this sludge must go to an authorised TSDF facility for disposal. Manifests for every sludge consignment are a compliance record. MPCB inspectors check them during site visits. Stage Two: Why an ETP Alone Is Not Enough for Many Industries For mandated sectors, a conventional ETP discharging treated water is no longer a compliant option. Certain Industries Cannot Discharge Any Liquid CPCB has made a Zero Liquid Discharge System compulsory for textile dyeing units, pharmaceutical manufacturers, distilleries, tanneries, and chemical plants in critically polluted areas. Even if the treated effluent meets general discharge standards, it cannot leave the premises as liquid. The mandate is absolute. Treated Water Still Has Dissolved Solids A conventional ETP brings BOD, COD, and suspended solids within permissible limits. But dissolved salts, residual colour, and trace compounds remain. That water cannot be reused in most industrial processes without further treatment. Closing that gap requires membrane and thermal technologies.  Stage Three: How a ZLD Plant Works, Step by Step The principle behind zero discharge is straightforward: concentrate all contaminants until only dry solid remains, and recover every drop of water for reuse. Ultrafiltration Protects Downstream Equipment After biological treatment, effluent passes through ultrafiltration membranes. UF removes any remaining suspended solids and colloidal matter. This step protects the reverse osmosis membranes that follow. Poor pre-treatment at this stage is the most common reason a ZLD Plant underperforms after commissioning. Reverse Osmosis Recovers the Bulk of the Water RO membranes reject dissolved salts while pushing clean water through as permeate. A well-operated RO stage recovers 50 to 75 percent of the feed volume as clean water ready for reuse. The concentrated reject stream, called brine, moves to the next stage. Multi-Effect Evaporation Concentrates the Brine The brine from RO enters a Multi-Effect Evaporator. Steam evaporates water from the concentrate across a series of vessels, each operating at lower pressure than the one before. This reuse of heat makes MEE significantly more energy efficient than single-stage evaporation. The water vapour is condensed and collected for reuse. The Crystalliser Produces the Final Dry Solid Concentrated brine from the evaporator enters a crystalliser. The remaining water evaporates and the dissolved salts crystallise into dry solid form. In textile facilities, recovered sodium sulphate is often commercial grade and can be reused directly in the dyeing process, reducing raw material costs. What Comes Out at the End A ZLD system has two outputs, and understanding both clarifies what zero discharge actually means in practice. Recovered Water Goes Back Into the Factory Water recovered at the RO permeate stage and from the evaporator condensate accounts for 90 to 95 percent of the total volume entering the system. This water is clean enough for cooling towers, toilet flushing, and in many cases direct process use. It replaces freshwater purchases and reduces dependence on municipal supply or borewell extraction. Dry Solid Is the Only Output That Leaves The crystallised salts exit the system as dry solid, not liquid. This goes to an authorised TSDF facility for safe disposal or is recovered as a usable byproduct. No liquid effluent crosses the factory boundary. That is what zero liquid discharge means in operational terms.  How CH Four Energy Solutions Delivers ZLD Systems That Perform Choosing the right implementation partner matters as much as choosing the right technology. Every System Is Designed for Your Specific Effluent CH Four Energy Solutions begins every ZLD project with a detailed analysis of the client’s actual effluent profile, volume, TDS, COD, and compound characteristics. A pharmaceutical plant in Pune requires a different treatment train than a textile unit in Maharashtra. Generic systems applied to specific problems underperform. Site-specific design is how you get to a reliable, cost-effective plant that passes every inspection. Complete Technology Stack and Reliable O and M With over 15 years of experience and 1,500 completed projects across Maharashtra and India, CH

Read More »
ZLD Plant Investment

Zero Liquid Discharge Plant: Is the Investment Worth It for Indian Industries? A Clear ROI Breakdown

A Zero Liquid Discharge System costs 4 to 5 times more than a conventional effluent treatment plant. For a 100 KLD capacity installation, the initial investment begins at ₹1 to 1.5 crore and for larger industrial units in pharma, textiles, or chemicals, that figure climbs considerably higher. On the face of it, the capital case looks difficult to justify. But that comparison misses the full picture. For industries in mandated sectors textiles, pharmaceuticals, tanneries, distilleries, and chemical manufacturers the question is no longer whether to invest. The question is whether the numbers actually work in your favour over time. For a growing number of Indian industries operating in water-stressed regions under increasing CPCB enforcement, they do. The Indian ZLD market is projected to cross ₹1,750 crore in 2026, and the growth is not driven by goodwill, it is driven by financial and regulatory reality. Which Indian Industries Are Legally Required to Have a ZLD Plant Understanding where the mandate applies is the first step before evaluating any financial case. Sectors Where ZLD Is Non-Negotiable The Central Pollution Control Board has identified specific sectors where a ZLD Plant is compulsory textile dyeing and processing units, pharmaceutical companies generating chemical-laden effluent, distilleries with high-BOD spent wash, tanneries handling chromium-laden wastewater, and chemical manufacturing plants in critically polluted areas. These industries cannot obtain or renew their Consent to Operate without demonstrating a functional zero discharge system. Textile clusters in Tirupur, Panipat, and Bhilwara and tannery clusters in Kanpur and Unnao have already faced closure notices and water connection disconnections for non-compliance. Industries Adopting ZLD Proactively Beyond the mandatory categories, food processing units, automotive manufacturers, power plants, and export-oriented facilities are increasingly adopting ZLD ahead of regulatory compulsion. The 2026 Draft Extended User Responsibility guidelines now require bulk water users drawing from borewells or municipal lines to demonstrate a defined level of water neutrality and a functional zero discharge system is the most direct path to achieving that status. EU and US buyers are also demanding ZLD certification as part of supply chain due diligence, making compliance a commercial requirement for export markets. What Does a ZLD Plant Actually Cost in India? The honest answer requires separating capital cost from total cost of ownership two numbers that rarely receive equal attention. Capital Investment — The Variables That Move the Number A Zero Liquid Discharge System at 100 KLD starts at ₹1 to 1.5 crore for membrane-based configurations. Thermal systems which use Multi-Effect Evaporators and crystallisers to handle high-TDS effluent streams cost more, but they handle what membranes alone cannot. The key cost variables are plant capacity, effluent complexity (pharmaceutical API streams cost more to treat than standard textile effluent), automation level, and whether the system is being built fresh or retrofitted onto an existing ETP. Operating Costs — The Number Most Leaders Underestimate OPEX generally runs from ₹80 to ₹150 per kilolitre of treated water. Energy is the dominant driver, consuming 80–100 kWh per cubic metre in thermal stages compared to just 0.5–1.5 kWh/m³ for conventional biological treatment. Chemical dosing, membrane replacement, sludge and salt disposal through authorised TSDF facilities, and O&M staffing make up the remainder. The good news is that hybrid membrane-thermal configurations and IoT-based dosing optimisation can reduce total OPEX by 15 to 22 percent compared to a poorly managed conventional thermal plant. The ROI Case — Where the Investment Pays Back Three distinct savings streams drive the financial return, and most ROI calculations only account for one of them. Freshwater Cost Savings — The Primary Driver ZLD systems recover 90 to 95 percent of water for internal reuse. In water-stressed industrial clusters, freshwater procurement costs range from ₹17/m³ in Ichalkaranji to ₹75/m³ in Tirupur. For a unit processing even 500 m³/day and recovering 90 percent, the annual freshwater saving at the lower cost bracket is substantial and at tanker rates during supply disruptions, which can be 3 to 5 times the standard municipal rate, the numbers improve significantly further. Byproduct Recovery — Turning Waste Into Revenue Many ZLD systems recover salts, minerals, and chemicals that can be sold or reused directly in production. Textile units recover sodium sulphate for reuse in dyeing processes, tanneries reclaim chromium for leather processing, and chemical plants extract valuable compounds from brine streams. This byproduct revenue is not speculative it directly reduces raw material procurement costs and partially offsets OPEX in the same financial period. Avoided Compliance Costs — The Calculation Most Plants Skip This is the savings stream that changes the financial case most dramatically. For industries in mandated sectors, operating without a compliant ZLD Plant means CTO cancellation risk, NGT-directed penalties under the Polluter Pays Principle that have run into crores for water body contamination cases, water supply disconnection, and production halts. None of these appear in a standard OPEX model but they are real, documented outcomes for identifiable facilities across India. The cost of a single enforcement action routinely exceeds the annual OPEX of a well-run ZLD system. Payback Timeline — What the Data Shows Capital cost is 4–5x a standard ETP, but freshwater savings and regulatory security typically deliver payback within 3 to 5 years. Chemical manufacturing units at 100 KLD have demonstrated returns in as little as 2.8 years. For textile mills using AI-optimised ZLD operations, payback from steam savings and membrane replacement avoidance alone has been recorded at 9 to 14 months. The variables that shorten payback most are: high local freshwater cost, large effluent volume, byproduct recovery potential, and the size of the compliance risk being mitigated. What Causes ZLD Plants to Underperform — And How to Avoid It Most ZLD investment failures are not technology failures they are design, sizing, and O&M failures. Poor Pre-Treatment and Undersizing Inadequate pre-treatment is the single most common cause of ZLD underperformance. Membranes foul rapidly, RO recovery rates drop, energy costs rise, and the plant fails to hit its designed water recovery targets. Equally common is undersizing a plant designed for projected effluent volumes that the facility subsequently exceeded. An

Read More »
Water Treatment Plants

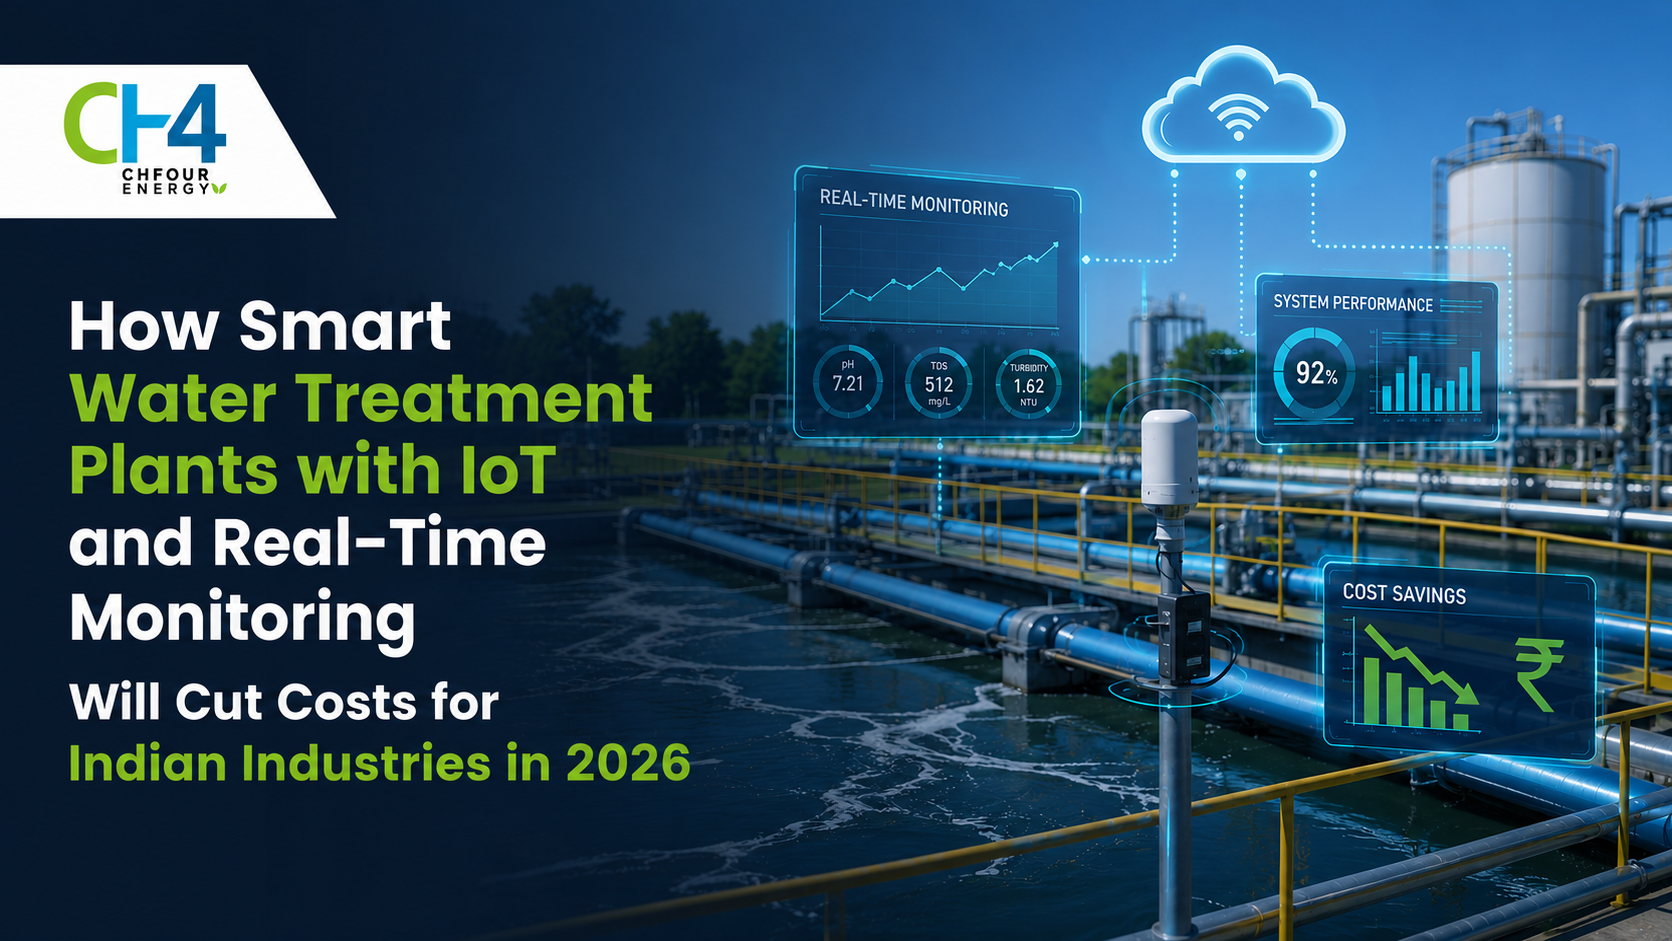
How Smart Water Treatment Plants with IoT and Real-Time Monitoring Will Cut Costs for Indian Industries in 2026

Most industrial ETPs and STPs across India are still being run on a reactive model. Samples are collected manually twice a day, sent to a lab, and results arrive 24 to 48 hours later. By the time a BOD spike shows up in a report, the non-compliant discharge has already left the plant. This is not just an operational inconvenience, it is a direct cost, and in 2026, it is also a serious regulatory risk. A Water Treatment Plant that cannot catch a process deviation until the following afternoon is one that will eventually generate a compliance notice. The Central Pollution Control Board has mandated Online Continuous Effluent Monitoring Systems (OCEMS) for 17 categories of highly polluting industries, with real-time data transmitting directly to CPCB and SPCB servers. IoT-enabled treatment plants are no longer an upgrade for progressive companies they are becoming the operational baseline. And beyond compliance, they are delivering measurable cost reductions across chemical consumption, energy usage, and equipment maintenance. Why the Traditional Treatment Model Is Costing Indian Industries More Than They Realise The financial impact of running a manually operated plant goes beyond what appears on a monthly chemical bill. Three Layers of Hidden Cost in Manual Plant Operations Manual water treatment management carries three consistent cost drains that most plant managers do not calculate together. First, chemical overconsumption: without real-time load data, operators dose conservatively to avoid under-treatment which means dosing more than the actual load requires, on every shift, every day. Second, fixed aeration schedules that run at the same intensity regardless of biological oxygen demand, wasting significant electricity during low-load periods. Third, delayed detection of parameter deviations that result in compliance violations each of which carries a penalty cost that far exceeds what a sensor network would have cost to install. CPCB OCEMS Mandate — Non-Compliance Is Now Automatic For Red category industries, OCEMS data is timestamped and flagged on the CPCB portal in real time as “Live,” “Delay,” or “Offline.” A delay or offline status triggers a compliance notice automatically without any inspector needing to visit the site. MPCB and other SPCBs are now operating with this same digital visibility. Industries running without connected monitoring infrastructure are generating notices they do not even know about until the paperwork arrives. What IoT Integration Looks Like Inside a Modern Treatment Plant Understanding the architecture is essential before evaluating the cost case here is what a connected plant actually consists of. A Sensor Network Across the Entire Process IoT integration begins with placing smart sensors at the inlet, across key treatment stages, and at the outlet. pH probes, dissolved oxygen analysers, flow meters, turbidity sensors, and COD/BOD monitors track every parameter continuously. All data flows into a centralised cloud dashboard accessible from a phone, laptop, or control room giving operators complete plant visibility without walking the floor. For a Packaged Wastewater Treatment System deployed at a mid-size manufacturing unit or commercial campus, this sensor architecture can be built in during installation, making it compact, pre-wired, and operational within days of commissioning. Automated Chemical Dosing and Demand-Responsive Aeration The most immediate cost reduction from smart treatment comes from replacing manual dosing and fixed aeration schedules with automated, load-responsive controls. Sensors continuously assess incoming effluent quality and adjust chemical addition and blower intensity in real time. This eliminates two simultaneous problems: overdosing during low-load periods and under-treating during production peaks. Both are wasteful one in chemicals, the other in compliance risk. Plants that have integrated automated dosing consistently report 15 to 20 percent reductions in coagulant and pH correction chemical costs within the first operational year. The Direct Cost Reductions IoT-Enabled Plants Are Delivering The financial case for smart water treatment infrastructure is no longer theoretical documented outcomes from Indian and global industrial facilities make it concrete. Energy Savings From Optimised Aeration Aeration is typically the single largest energy cost in biological treatment systems. A fixed-speed blower running on a predetermined schedule consumes the same power regardless of actual biological oxygen demand at any given hour. Smart systems replace this with demand-responsive operation blower speed and runtime adjust to real-time dissolved oxygen readings in the aeration tank. Research and operational data from facilities that have made this transition consistently show energy cost reductions in the double-digit percentage range from aeration optimisation alone. For a large industrial plant processing several hundred kiloliters per day, this is a meaningful annual saving. Reduced Compliance Penalties and Inspection Exposure Every hour of compliant operation logged with a real-time timestamp builds the audit trail that regulators now demand. During an MPCB inspection or consent renewal, a plant with 12 months of continuous, clean OCEMS data is in a categorically stronger position than one presenting manual lab reports. Industry research indicates that facilities using IoT automation expect more than 20 percent reduction in compliance-related costs covering avoided penalties, reduced legal exposure, and faster consent renewal processing. Predictive Maintenance — Stopping Failures Before They Cost You Sensors continuously monitor equipment performance pump motor draw, diffuser backpressure, aerator current consumption and flag deviations that indicate early-stage wear before a breakdown occurs. A failed aerator that goes unnoticed for 12 hours can cause a biological treatment collapse and a direct compliance violation. Planned maintenance based on sensor-predicted wear is consistently cheaper than emergency repair, and it never creates an unplanned gap in treatment continuity. Real Outcomes From Indian Industrial Facilities The shift to smart treatment infrastructure is already producing measurable, documented results across the Indian industrial sector. 11% Daily Water Usage Reduction at an Indian Beverage Plant A documented case study from an Indian beverage manufacturing facility showed that real-time monitoring identified water overconsumption hotspots across the production line data that was simply invisible under the previous manual monitoring regime. The corrective measures that followed reduced daily water consumption by 11 percent. Critically, the same IoT infrastructure that produced compliance data also revealed where process water was being wasted before it even reached the treatment plant, delivering savings well beyond the ETP itself. Zero Compliance Violations

Read More »